Friday Fun: Monitor your Pi with Anvil
I've not done a Friday fun project for a while...so this is a big one! Get a beverage and prepare to write your own web app in Python.
So what are we building?
For this Friday (ahem I'm writing this on a Sunday) project we are building a web app that will monitor and graph data from a running Raspberry Pi 4.
It will gather the following data
- CPU temperature
- CPU utilisation (how hard it is working)
- Current available RAM
All of this is written in Python, the web app and the server code that will run on our Pi. WOW!
For this project you will need:
Any model of Raspberry Pi
An Internet connection
A computer to write the Anvil code (if you are using a Pi4 then you can use that!)
Setting up your Anvil account

Head over to the Anvil website and click on the orange BUILD> button to start. If you don't have an account, sign up! It is totally free and the free tier is plenty for this project.
Create a new app.
Choose the Material Design theme, as it is easy to work with.

Rather than name our project "material design 4" we can change the name rather easily to something much more relevant. So go ahead and do this.
Table Service
No I don't mean that you will be waited on with food and drinks! In the Services menu there is an option to add a table to store data. Go ahead and add a table as per the GIF below.
To name our table we need to click on the plus (+) sign at the top of the table and then name the table pi4server.
To add column headings and the type of data which is stored in the rows, we need to click on a column heading (+) and add the headings and types.
- when, date and time
- temp, number
- cpu, number
The table will need two permissions to be set. The first enables forms (what Anvil uses as the visible web interface) to read and search data in the table. The second permission is for Server Modules (code which shall be running on the Raspberry Pi 4) to create search and delete data from the table. If these permissions are not set then the app will not work. (Trust me I spent 30 minutes trying to solve this)
An added bonus of adding the Data Table service is that all of the Python imports that will enable us to use the code are done for us! Marvelous.
Give the form a title
The form is where Anvil enables us to create a user interface. So with that in mind we need to give our form a name.
Using the Label tool from the Toolbox, we drag it over the title box at the top left of the form. Then change the text in the Properties box to Pi 4 Server.
Setup two scatter graphs
Anvil has a built in tool to enable the addition of graphs. It is based on plotly, itself a great Python library (possibly a #TuesdayTooling blog post?).
To use a graph we need to drag the plot tool from the Toolbox, and place it in the form. Here I add a graph for the CPU temp. You will see in the GIF that I change the name of the plot to plot_temp via the Properties tab.
I then made another graph for the CPU utilisation. Calling the graph plot_cpu
Also, looking back to the code for the project (in the Code tab) we see that plotly has been imported for us! Nice!
Adding some code for our graphs
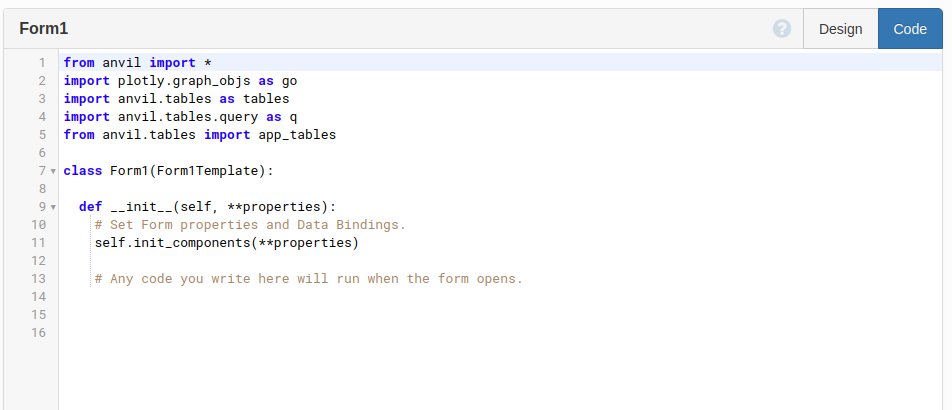
Click on the Code tab and you will see code that works behind the scenes of the form. It should look like this.
from anvil import *
import plotly.graph_objs as go
import anvil.tables as tables
import anvil.tables.query as q
from anvil.tables import app_tables

class Form1(Form1Template):

  def __init__(self, **properties):
    # Set Form properties and Data Bindings.
    self.init_components(**properties)

    # Any code you write here will run when the form opens.
You can see all the imports that Anvil has handled for us! The Form has its own class and in there we will write the code to format our graphs.
The first and second line in this section set the graph title for the plot_temp and plot_cpu graphs. Then the third and fourth lines set the horizontal axis (x) title for each graph. The fifth and sixth lines set the vertical axis (y) for the graphs. Lastly I tell the graphs to update.
    self.plot_temp.layout.title = 'CPU Temp (c)'
    self.plot_cpu.layout.title = 'CPU Utilisation %'
    self.plot_temp.layout.xaxis.title = 'Time'
    self.plot_cpu.layout.xaxis.title = 'Time'
    self.plot_temp.layout.yaxis.title = 'Temperature (c)'
    self.plot_cpu.layout.yaxis.title = 'CPU usage %'
    self.update_plots()
Using data from the table
Remember the pi4server data table that we created earlier? Well now is the time to get data from the table and place it in the graphs. For this we create a function update_plots() which we also used earlier to update the titles of the graphs!
The function works by first setting the updates to appear without a loading indicator (spinner). Then a variable called data is created and it is used to search the data table pi4server. Next the choice of graph is set to scatter and the data for each axis is selected.
Now we update the plot for plot_temp_data.
For the horizontal (x) axis the data is when which is the time stamp of when the data is collected. The vertical (y) axis data is the temp temperature of the CPU. So now we can plot the temp at a particular time to the graph.
Next is the data for the CPU utilisation graph and this follow the same format as before. The plots are made to the plot_cpu_data graph.
  def update_plots(self):
    with server.no_loading_indicator:
      data = app_tables.pi4server.search()
      self.plot_temp.data = go.Scatter(
        x=[r['when'] for r in data],
        y=[r['temp'] for r in data],
      )
      self.plot_cpu.data = go.Scatter(
        x=[r['when'] for r in data],
        y=[r['cpu'] for r in data],
      )
Note: that to write the data to the graph using the
dataobject we need to useself.plot_temp.dataandself.plot_cpu.data. Otherwise the code will get really confused...I know I did.
Regularly updating the plots
For our update_plots() function to regularly update the graphs we need to use a timer tool from the Toolbox. This will be an invisible component. Drag the tool to the bottom of the form and let go.
To edit the timer, double click on the component and it will open the code to the correct position..Neat!
The code that needs to go in there is...
  def timer_1_tick(self, **event_args):
    """This method is called Every [interval] seconds. Does not trigger if [interval] is 0."""
    self.update_plots()
    pass
Give the code a test!
Right now there is no data for the graphs, but we can still test that they work. Click on Run and the screen will update and show the graphs in the form. When finished click on Stop, to...well, stop.
Add an available RAM indicator
We have graphs for CPU temp and utilisation, but how much RAM do we have? Well it is easy to show this. First we need to drag a Label to the bottom of the form. The label will be renamed RAM and in the Properties I keep the text as left aligned, but set the font to bold and the font_size to 32.

I also add another label which is used to indicated what the value refers to. For this I add the label to the left of the RAM label, and change the new label alignment to Right and the font_size to 32 matching the RAM label.
Adding another Timer will enable us to control how often the Available RAM indicator is updated. Add the time from More Components, and then in the Properties for the timer, change the interval to 1, for one second. Then double click on the timer to edit the code for it.
The code for timer 2 runs a call to our Raspberry Pi, specifically a function that we shall write later. This will get the available RAM and this is saved to the variable memory which is then used to populate the text of the self.RAM label.
  def timer_2_tick(self, **event_args):
    memory = anvil.server.call('ram')
    self.RAM.text = memory
    pass
Connecting to the Raspberry Pi
That is all the code that we need, but we still need to connect this project to the Pi. To do that we need to run an uplink connection. This can be found in the Settings Cog, on the left of the screen. Don't worry too much about the instructions on this page, but do remember to click on Enable the Anvil Server Uplink for this app (I don't click on this in the GIF as it would show my unique key, also don't share your key!)
Another handy import, our code now has the anvil server library installed!
All of the code written in Anvil
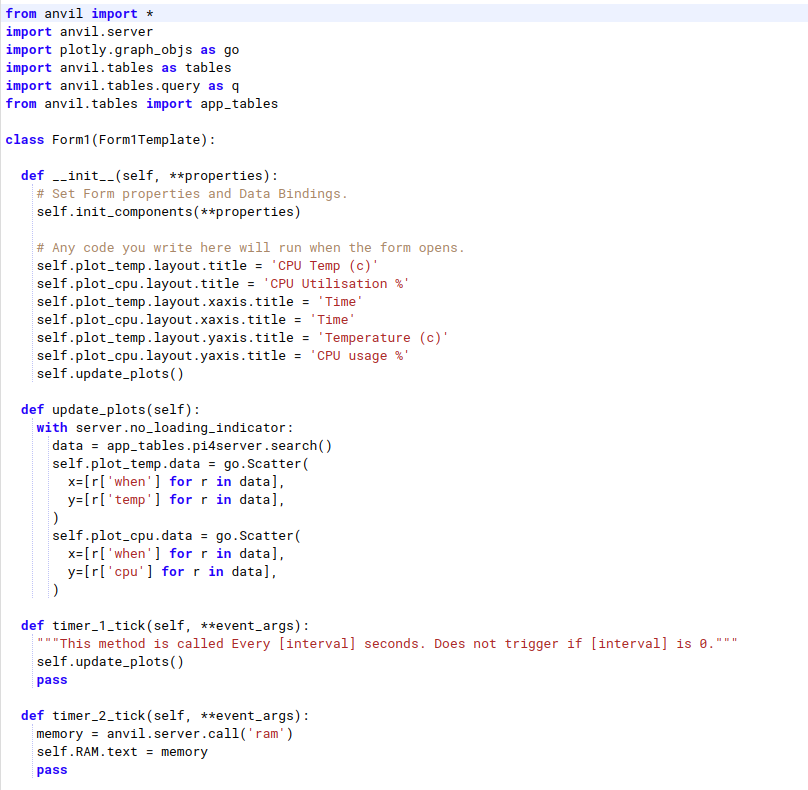
Below is all of the code written in Anvil, before moving on, check your code!
from anvil import *
import anvil.server
import plotly.graph_objs as go
import anvil.tables as tables
import anvil.tables.query as q
from anvil.tables import app_tables

class Form1(Form1Template):

  def __init__(self, **properties):
    # Set Form properties and Data Bindings.
    self.init_components(**properties)

    # Any code you write here will run when the form opens.
    self.plot_temp.layout.title = 'CPU Temp (c)'
    self.plot_cpu.layout.title = 'CPU Utilisation %'
    self.plot_temp.layout.xaxis.title = 'Time'
    self.plot_cpu.layout.xaxis.title = 'Time'
    self.plot_temp.layout.yaxis.title = 'Temperature (c)'
    self.plot_cpu.layout.yaxis.title = 'CPU usage %'
    self.update_plots()

  def update_plots(self):
    with server.no_loading_indicator:
      data = app_tables.pi4server.search()
      self.plot_temp.data = go.Scatter(
        x=[r['when'] for r in data],
        y=[r['temp'] for r in data],
      )
      self.plot_cpu.data = go.Scatter(
        x=[r['when'] for r in data],
        y=[r['cpu'] for r in data],
      )

  def timer_1_tick(self, **event_args):
    """This method is called Every [interval] seconds. Does not trigger if [interval] is 0."""
    self.update_plots()
    pass

  def timer_2_tick(self, **event_args):
    memory = anvil.server.call("ram")
    self.RAM.text = memory
    pass
Moving over to the Raspberry Pi
The code written from this point onwards will be on our Raspberry Pi 4 (or whatever Pi you want to use)
Power up your Raspberry Pi and when ready open a terminal.
Installing Python packages
We need two Python packages installed before we can more on. One is the Anvil uplink package, the other is psutil which I covered in a recent Tooling Tuesday blog post
In the terminal type the following
sudo pip3 install psutil anvil-uplink
Once completed, you can close the terminal.
Writing the code on our Raspberry Pi
I chose to write the code for this project using Thonny, it is a remarkable IDE for Python, and it is now the default editor for the Raspberry Pi.
Importing libraries
import anvil.server
from anvil.tables import app_tables
from datetime import datetime
import time
import psutil
To enable this project to work, we need to import a series of Python packages. The first is the anvil.server package which connects this Pi to the Anvil code we have written. The anvil.tables package enables our code (a server module which we gave permission to access the Data Table we created earlier) to write data to the table. The use of datetime provides us with a timestamp for each reading. Using time we can pause the code between readings. Lastly psutil is the tool used to read CPu temps, utilisation and available RAM.
Connecting to Anvil
anvil.server.connect("YOUR ANVIL UPLINK CODE")
Our Pi is a server which will send data to the web app. To do that we need to supply our uplink code using the anvil.server.connect() method. This will return a message to us. All being well, you will see this.
Connecting to wss://anvil.works/uplink
Anvil websocket open
Authenticated OK
Anvil server output: You're using the Anvil Free plan. Upgrade at https://anvil.works/
Calling a function from Anvil
Remember the RAM label we created earlier? Well in the Anvil code we call a function called ram() on the server, our Pi. So we need to write the code for it. The function get the current available memory from psutil.virtual_memory() and stores the value in an object called memory. The object is really a list and so to get the current available memory we need to extract that value, stored at index 1 in the list. The value stored in memory is then updated as the output of the equation memory / 2014 / 1024 round to the nearest decimal place.
Finally I return the value of memory as a string, and add "MB" to indicate the value stored in memory is our available RAM in Megabytes.
def ram():
    memory = psutil.virtual_memory()
    memory = memory[1]
    memory = round(memory / 1024 / 1024)
    return(str(memory)+"MB")
Hey Les, why all the maths for the memory?
Good question reader! the value returned by psutil is in bytes, so to convert to Megabytes we need to divide the values by 1024 twice.
In the loop
To constantly get the data that we need a while True loop is used. Inside the loop the first step is to store the cpu_percentage, in other words the utilisation, how hard the CPU is working. For this we use psutil.cpu_percent and set the interval to one second then store the value in the variable. The next action is to get the temperature of the CPU and store it in an object, thermal. But the returned value is a mix of a dictionary and embedded lists, so we need to slice out the data that we need using the dictionary key "cpu_thermal" and tow indexes of 0 and 1.
while True:
    cpu_percentage = psutil.cpu_percent(interval=1)
    thermal = psutil.sensors_temperatures()
    thermal = round((thermal["cpu-thermal"][0][1]))
Still inside the loop and this next bit of code will add a row to the pi4server data table in our Anvil app.
- when
- Uses
datetime.now()to create the timestamp
- Uses
- cpu
- Uses the value stored in
cpu_precentageto show how hard the CPU is working.
- Uses the value stored in
- temp
- Uses the value stored in
thermalto show the current temperature of the CPU
- Uses the value stored in
    app_tables.pi4server.add_row(
        when=datetime.now(),
        cpu=cpu_percentage,
        temp=thermal
    )
The
app_tables.pi4servercode can be written as one long line, or as above. There is probably some PEP Python style guidance for this, but it is not mandatory.
The next two lines in the loop call the ram() function that will send the available RAM value to the Anvil app. Then there is a 10 second pause between loops.
    ram()
    time.sleep(10)
Outside of the loop, and at the very end of the code is a simple line that will tell the anvil server to wait forever.
anvil.server.wait_forever()
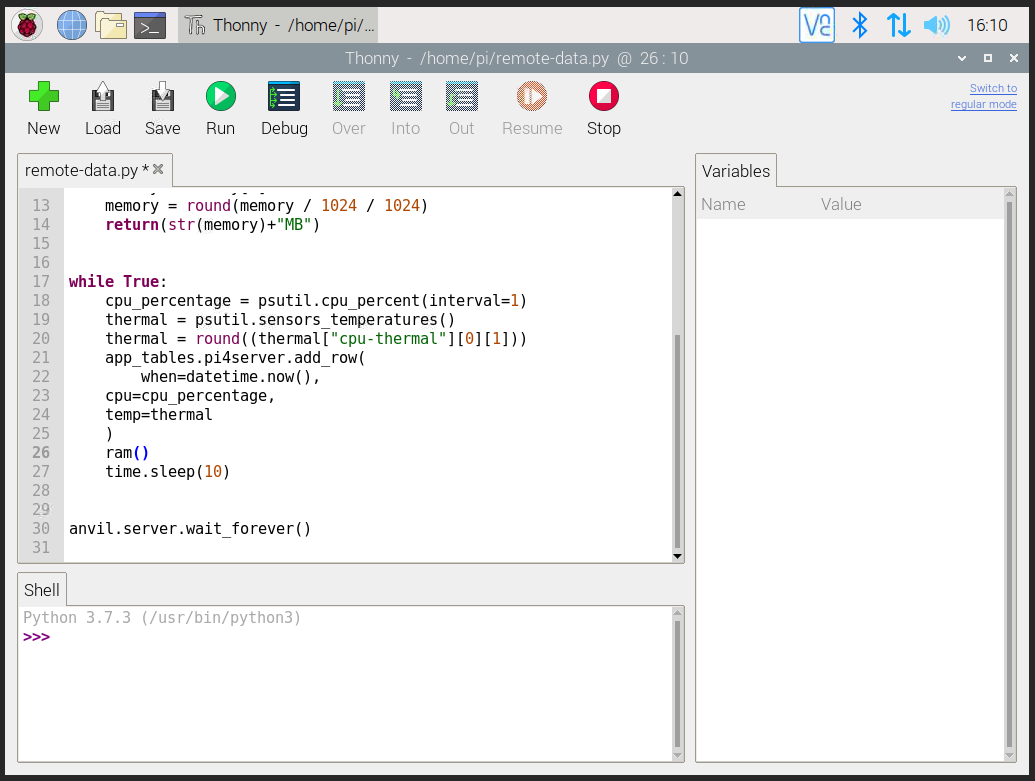
Complete Raspberry Pi Code Listing
Here is all of the code for the Raspberry Pi server. Check your code matches before moving on.
import anvil.server
from anvil.tables import app_tables
from datetime import datetime
import time
import psutil
anvil.server.connect("YOUR ANVIL UPLINK CODE")

@anvil.server.callable
def ram():
    memory = psutil.virtual_memory()
    memory = memory[1]
    memory = round(memory / 1024 / 1024)
    return(str(memory)+"MB")


while True:
    cpu_percentage = psutil.cpu_percent(interval=1)
    thermal = psutil.sensors_temperatures()
    thermal = round((thermal["cpu-thermal"][0][1]))
    app_tables.pi4server.add_row(
        when=datetime.now(),
        cpu=cpu_percentage,
        temp=thermal
    )
    ram()
    time.sleep(10)


anvil.server.wait_forever()
Test the code
On your Raspberry Pi
Using Thonny save the code as remote-data.py and then click on Run to start the server.
In Anvil
Click on Run to start the app.
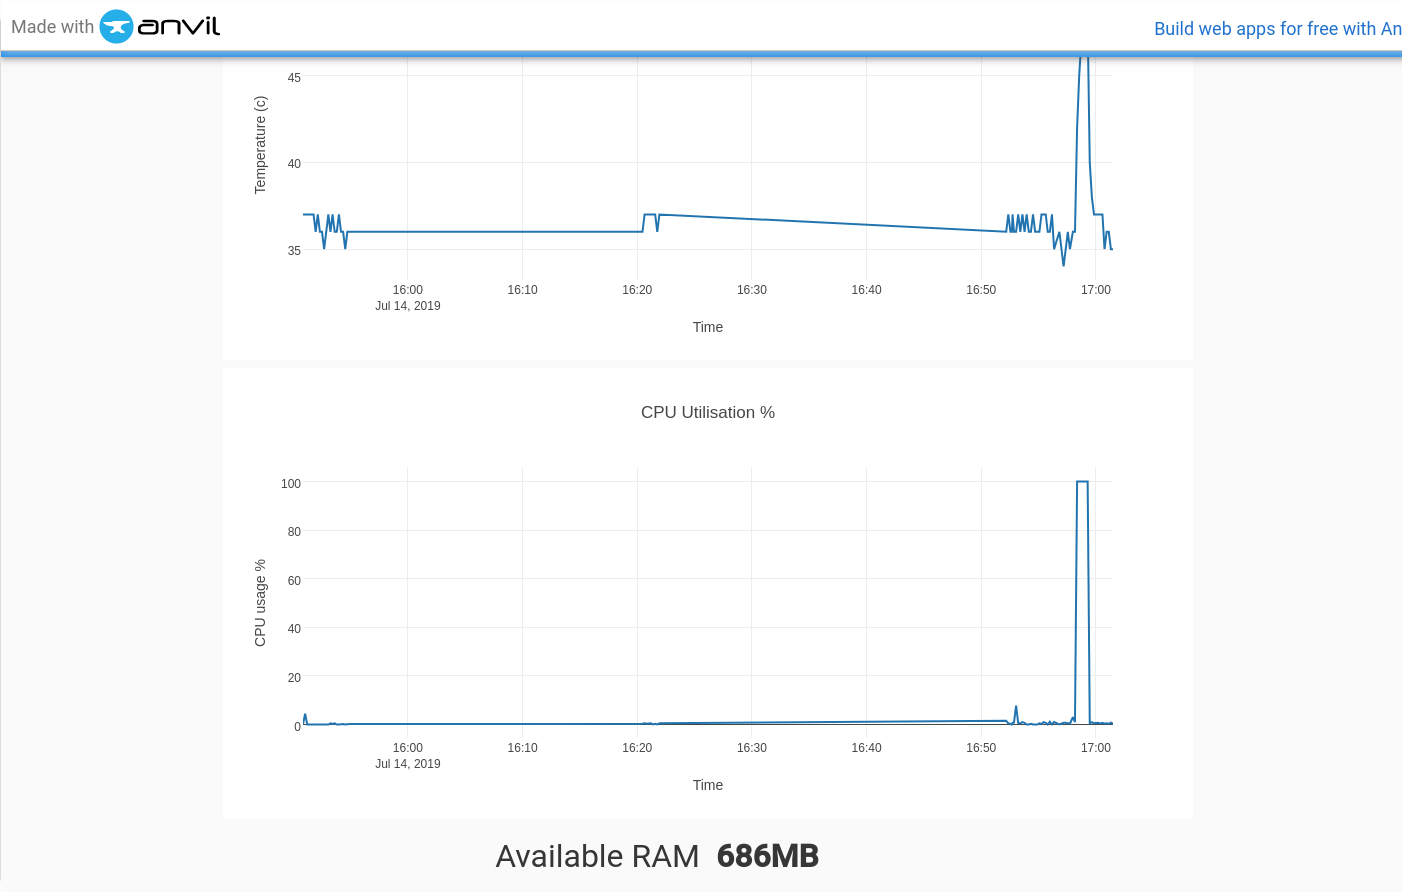
Hopefully if all works ok you will see something like this!
Publish the app
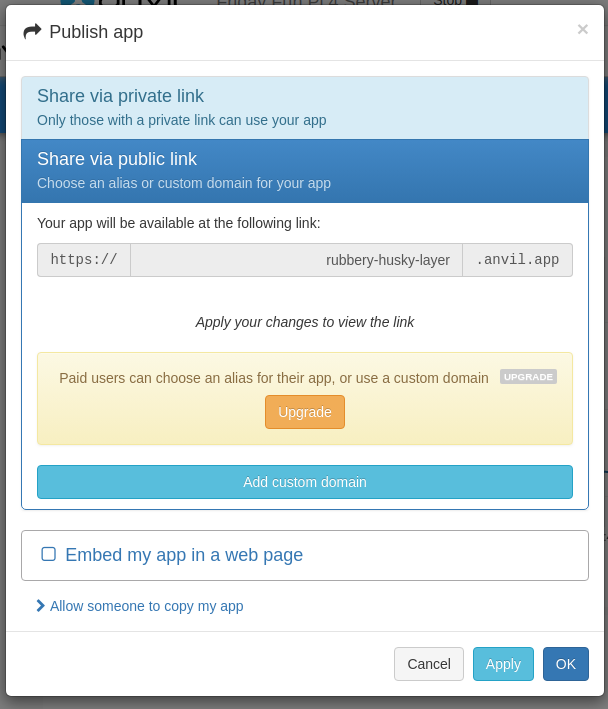
Anvil enables you to create an app that can be shared privately, or publicly.
While the app is running we can click on Publish this app and then click on Share via public link get an "unique" URL (yes it is random, sometimes it looks a little weird but all is good) click on Apply to set the URL and then click on Copy to copy the URL.
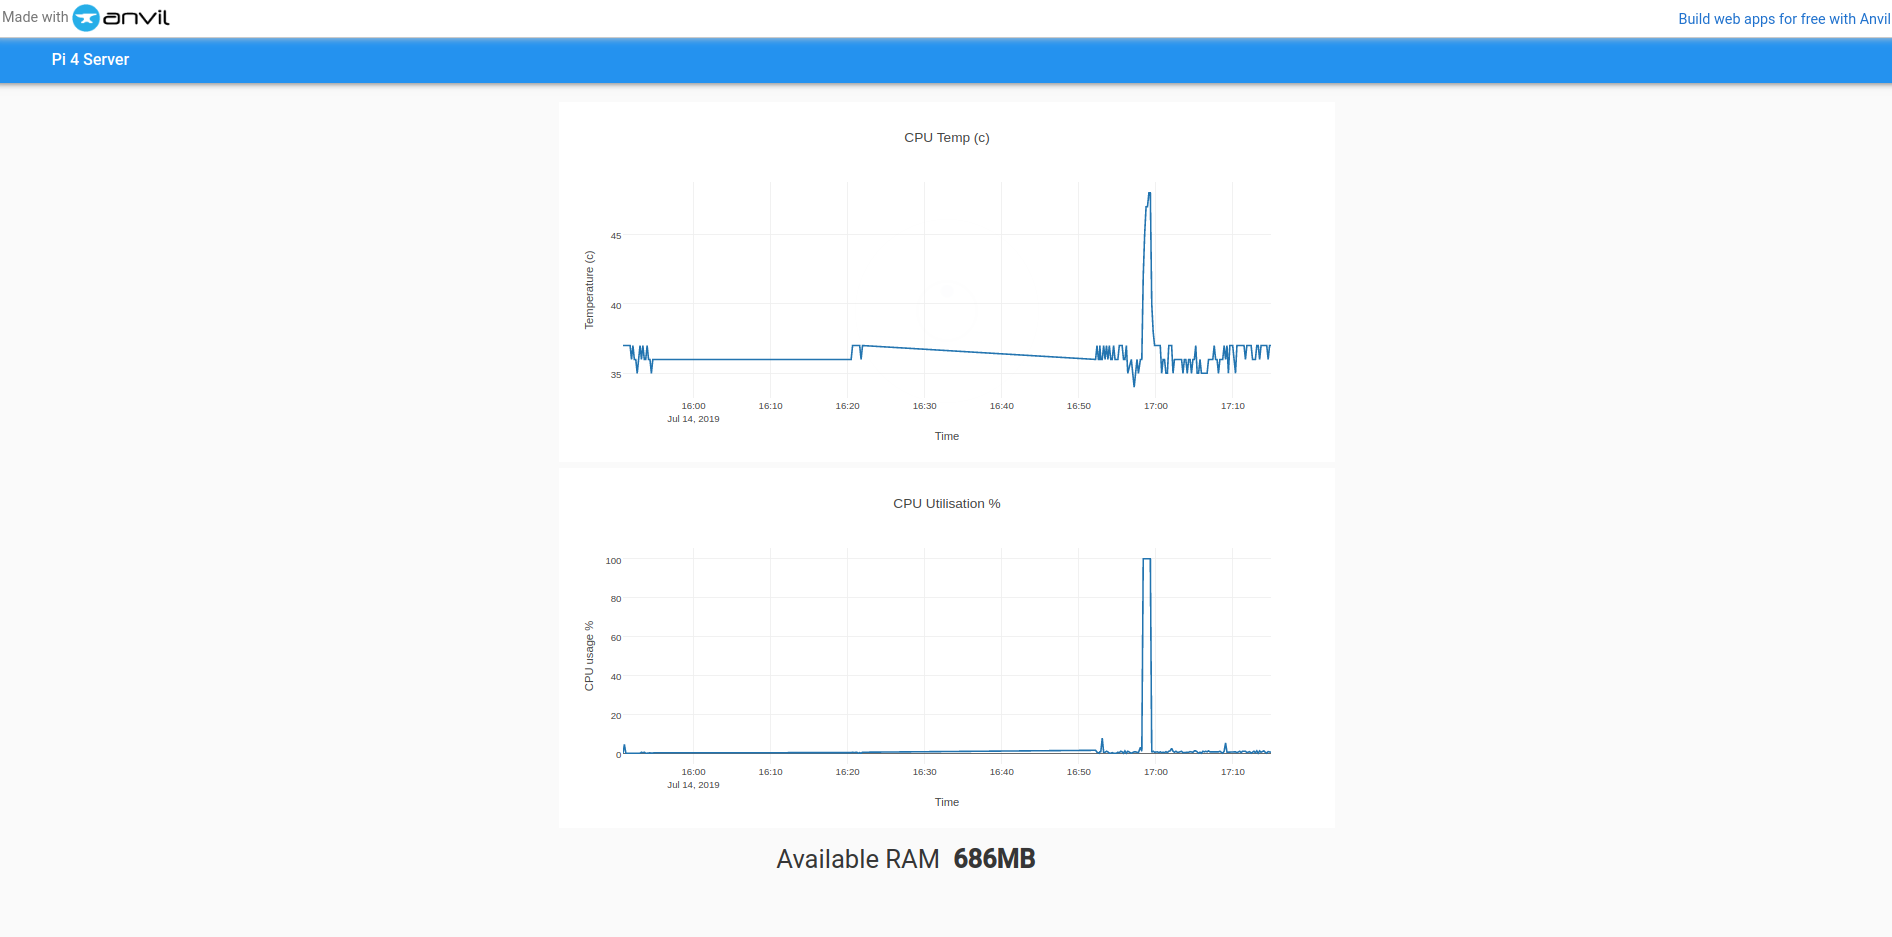
Paste the URL into your web browser and you should see something like this.
So there we have it!
We made a web app in pure Python! The app gathered data from a running Pi server, and displayed the data automatically in a graph.
Anvil is great fun to use and the documentation, resources and examples are sublime. Have fun hacking with this project!