Tuesday Tooling: Plot Maps With Python
Maps are cool! Python is cool! Where is the nearest Greggs?
So What Is Gmplot?
"A matplotlib-like interface to render all the data you’d like on top of Google Maps."
Excuse me?
Gmplot is a library to draw on top of Google Maps. I've used it for a couple of projects, one was for element14 to celebrate the release of the Raspberry Pi 3B+. The other project was for an episode of Tom's Hardware: The Pi Cast where I showed off Pimoroni's new GPS breakout board, jump to 25:53 in the video below to see it in action.
So What Can I Do With It?
With gmplot we can
- Place points on a map using latitude and longitude, or names.
- Draw areas on a map, for example a course to follow.
- Create heat maps, so the more occurrences at a position, the more "heat" / activity is shown.

Hi reader!
So How Can I Install It?
Using pip of course!
On Linux / Mac with pip3 installed.
sudo pip3 install gmplot
On Windows
pip3.exe install gmplot
So How Do I Use It?
Lets write a little Python code that will centre a map on top of Blackpool Tower. First of all, how do I find out where Blackpool Tower is? I Googled it.
Once Google had located Blackpool Tower, I right clicked on the Tower and it gave me a list of data, the first entry being the latitude and longitude. I copied that (left click) and then wrote a little Python code.
The Python Code
import gmplot
import webbrowser
First I import the gmplot library, then import the webbrowser library, which will later automatically open a web page.
tower = gmplot.GoogleMapPlotter(53.81604806664296, -3.0548307614209813, 18 )
Next I create an object, tower that holds the latitude and longitude of Blackpool Tower. You're probably thinking "What is that number at the end?" Well dear reader, that number is a stepped zoom feature. The larger the number, the closer we are to the position. In this case 18 lands us on top of the Tower, but not too close. Changing the value to 13 shows a large section of the town.
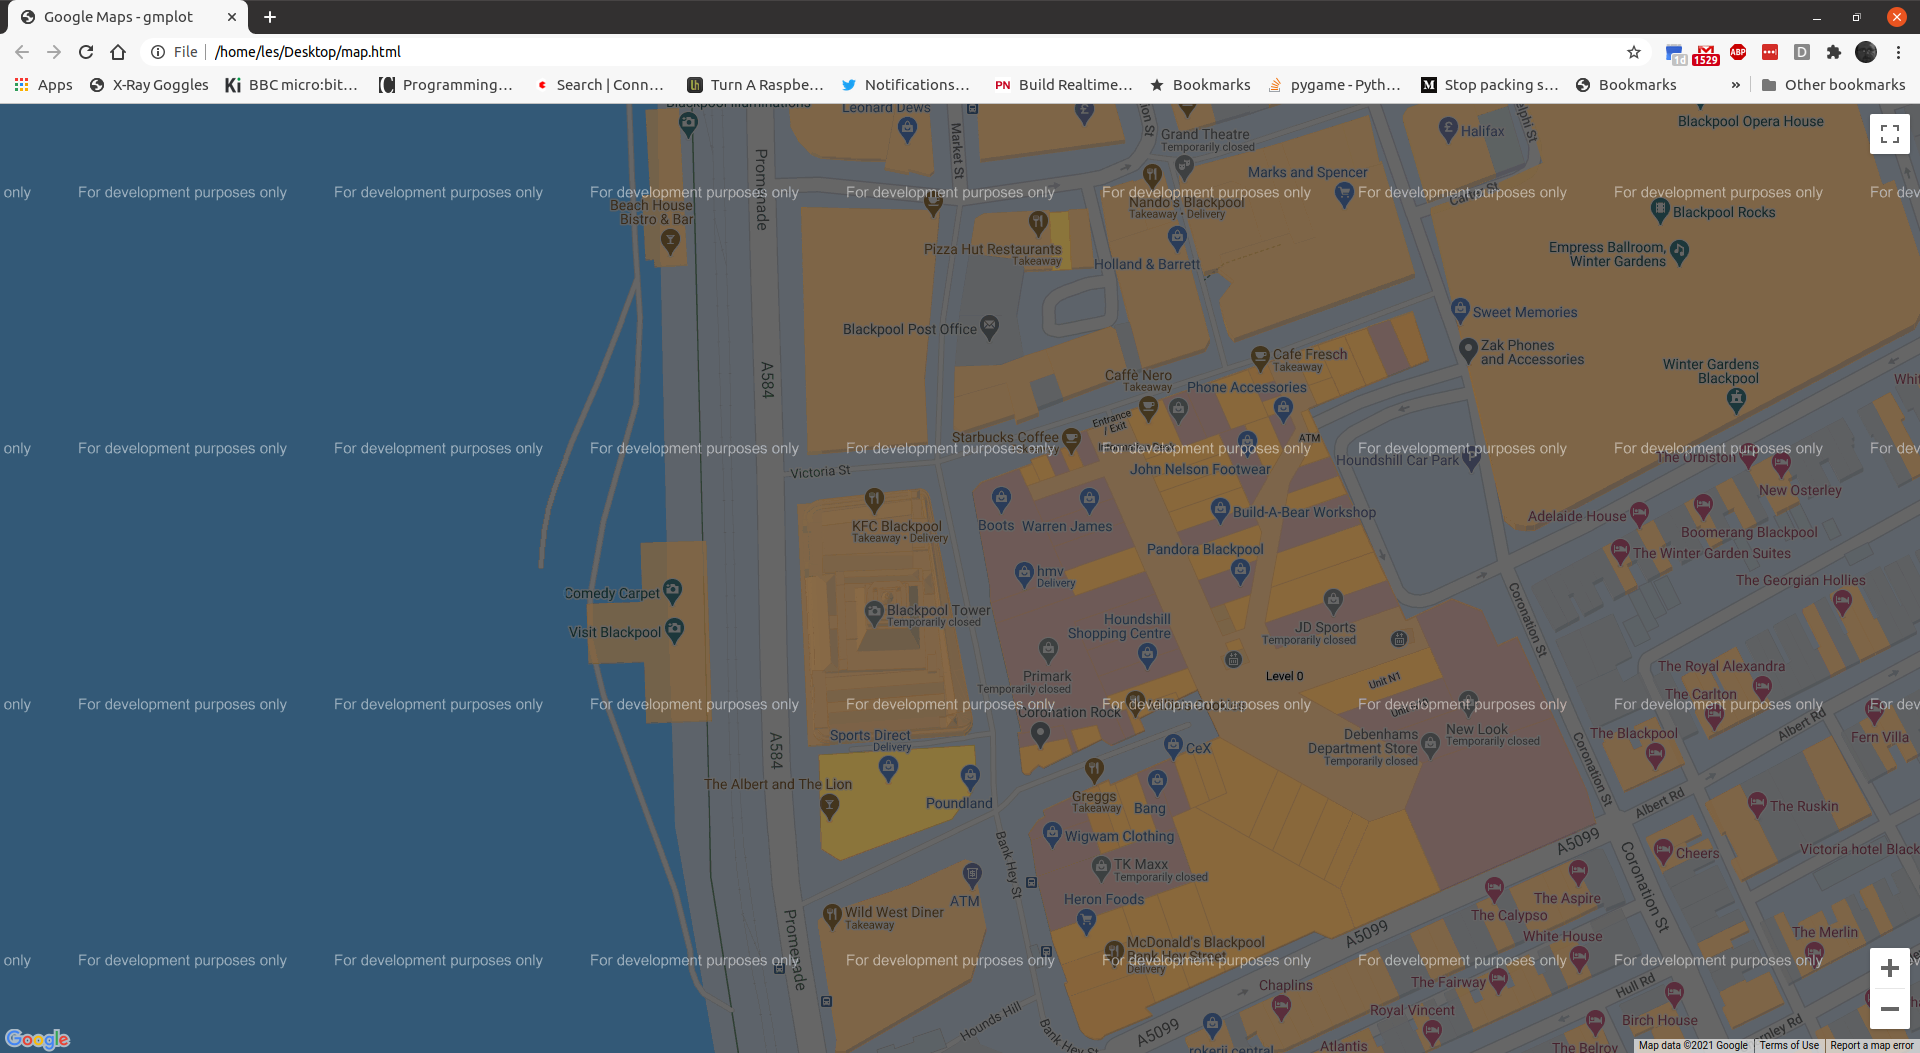
tower.draw( "/home/les/Desktop/map.html" )
webbrowser.open_new_tab("/home/les/Desktop/map.html")
The last part of the code draws the map to a new HTML file, in this case located on the desktop of my Ubuntu laptop. I then open a new webbrowser tab and pass the file location as the URL.
Heatmaps!
You know the latitude and longitude coordinates of some interesting items in your area. How do we show them on the map? Use a hotspot!
In this example I build upon the code from last time
import gmplot
import webbrowser
by adding two lists, each list shows the latitude and longitude for all of the Poundland stores in Blackpool. The two lists work hand in hand. So to find the location of Poundland 1 in Blackpool we need the first item from each list.
lat = [53.780013554454996, 53.798799717653516, 53.81555058669799, 53.816817399799255]
lon = [-3.0313782458904974, -3.017688250741286, -3.054423785823612, -3.0554322964380516]
We centre the map on Blackpool Tower, and change the zoom to see more of the town.
tower = gmplot.GoogleMapPlotter(53.81604806664296, -3.0548307614209813, 13 )
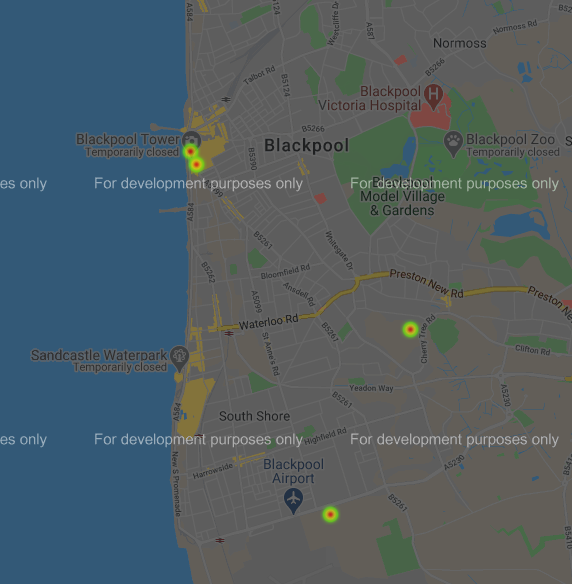
We then plot the hotspots on the map, and then create the HTML file and open it in a browser.
tower.heatmap(lat, lon)
tower.draw( "/home/les/Desktop/map.html" )
webbrowser.open_new_tab("/home/les/Desktop/map.html")
I run the code and I see the map appear, showing all of the Poundland stores that I shop in.
Add Text!
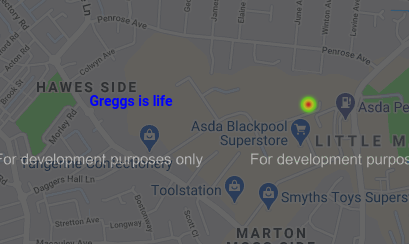
Ok final feature to show off is that we can add text to the map. Here I update the tower object to write text at the location of Greggs Bakery!
tower.text(53.79888147611809, -3.0253057215368746, 'Greggs is life', color='blue')
It needs the latitude and longitude of the store, the text, and the text colour.
Full Code For Reference
import gmplot
import webbrowser
lat = [53.780013554454996, 53.798799717653516, 53.81555058669799, 53.816817399799255]
lon = [-3.0313782458904974, -3.017688250741286, -3.054423785823612, -3.0554322964380516]
tower = gmplot.GoogleMapPlotter(53.81604806664296, -3.0548307614209813, 13 )
tower.text(53.79888147611809, -3.0253057215368746, 'Greggs is life', color='blue')
tower.heatmap(lat, lon)
tower.draw( "/home/les/Desktop/map.html" )
webbrowser.open_new_tab("/home/les/Desktop/map.html")
You Said That I Can Give the Name of a Place?
Yup it can, but since I last used that feature, we now have to sign up to use the Google Maps API. More details on the project's GitHub page